
Overview
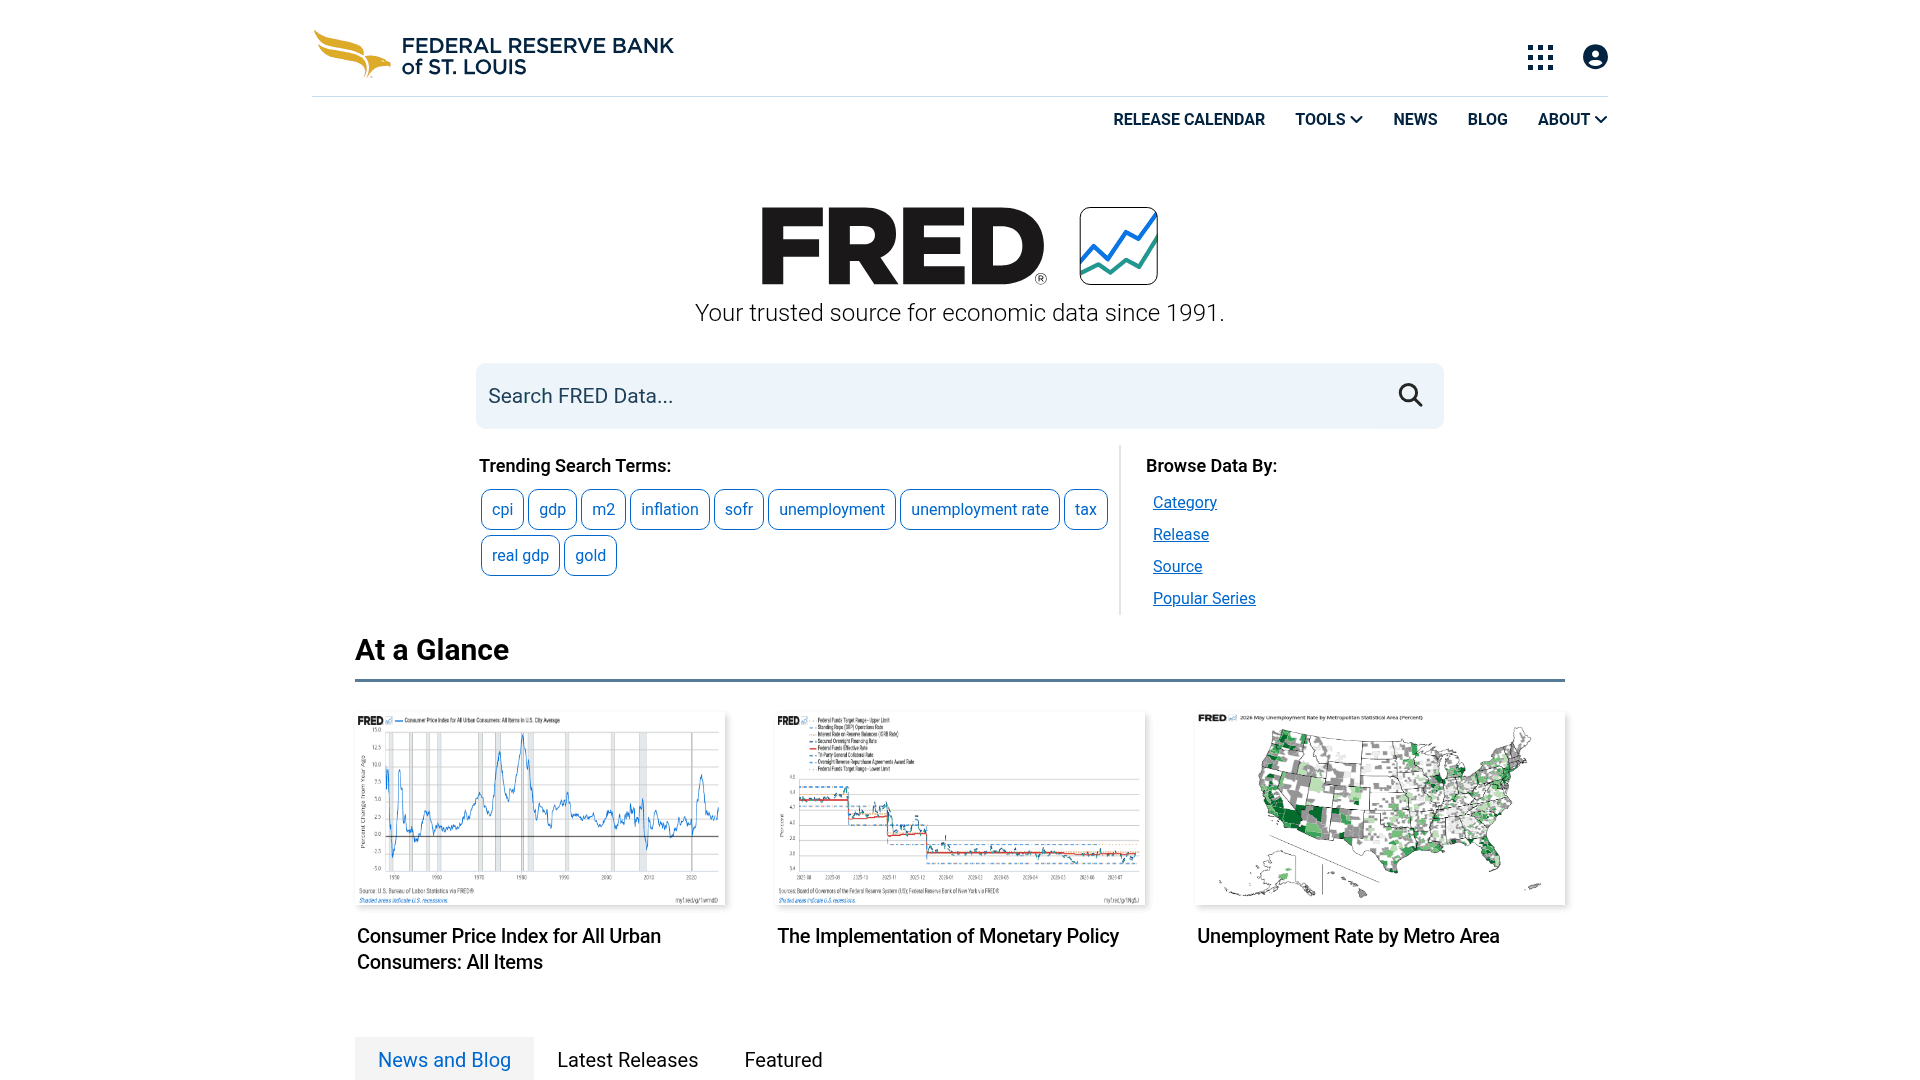
What is FRED: FRED is an online database of more than 840,000 economic time series, maintained by the Research Department at the Federal Reserve Bank of St. Louis and published since 1991. Coverage spans banking, employment, consumer and producer price indices, GDP, interest rates, exchange rates, and trade, with series drawn from many source organizations represented in FRED. The FRED API returns data over HTTPS GET in XML or JSON, with CSV and XLSX available for observations.
How to integrate FRED with Datagrid
The FRED Datagrid integration imports selected series observations and metadata into Datagrid on a schedule you set, so Datagrid's AI agents can normalize, transform, and analyze that data alongside your other connected systems, then route it to the right destination. FRED is read-only, so all data flows one way, from FRED into Datagrid; because FRED offers no webhooks, Datagrid polls for updates rather than waiting for push events. Follow this setup order: connect FRED in Datagrid, authenticate with your FRED API key, then configure scheduled data syncs.
Connect FRED in Datagrid
Start by creating a FRED connection in Datagrid and selecting the FRED data your teams need for reporting.
Log in to your Datagrid account and go to Settings > Connectors > Add New.
Search for FRED in the integration catalog.
Enter your FRED API key. Request one at the FRED API key portal if you don't have one.
Select the series, categories, or releases you want to sync.
Configure the sync schedule.
Click Save and run the first sync.
A Datagrid FRED connection follows this setup pattern:
connection: FRED
authentication: FRED API key
sync_scope: selected series, categories, and releases
schedule: configured per connection
Authenticate with a FRED API key
Use FRED's API key authentication during setup, then store the key in Datagrid for scheduled syncs.
FRED supports only API key authentication. The key is a 32-character lowercase alphanumeric string tied to a FRED user account. API v1 passes it as the api_key query parameter. API v2 passes it as an Authorization: Bearer header. Request a distinct key for each application.
Example API v2 authentication header:
Authorization: Bearer YOUR_FRED_API_KEYConfigure scheduled data syncs
Define the Datagrid's import scope, polling cadence, pagination, and handling of missing observations.
Objects synced: Datagrid syncs series observations, series metadata (title, frequency, units, seasonal_adjustment, last_updated), release metadata, category hierarchies, and tag structures.
Direction: The sync runs in one direction, from FRED to Datagrid. The FRED API uses HTTPS GET requests and exposes no write endpoints.
Frequency: Datagrid uses scheduled polling, configured per connection. FRED series updates at their native cadences, from daily to annual.
Pagination: The
fred/series/observationsendpoint supports up to 100,000 observations per request with offset paging. API v2's bulk release endpoint uses cursor-based pagination vianext_cursorandhas_more.Missing values: FRED returns missing observations as the string ".". Datagrid treats that sentinel separately from null during ingestion.
Example observations request with a CPI series, year-over-year transformation, and offset paging:
GET /fred/series/observations?series_id=CPIAUCSL&units=pc1&limit=100000&offset=0&api_key=YOUR_FRED_API_KEYExample missing-value response shape:
{
  "observations": [
    {
      "date": "YYYY-MM-DD",
      "value": "."
    }
  ]
}
Why use FRED with Datagrid
FRED gives teams trusted macroeconomic data. Datagrid turns that data into scheduled workflows that Datagrid's AI agents analyze, compare, and route without manual spreadsheet handling.
Scheduled ingestion replaces manual downloads: Agents pull GDP, unemployment, and rate series at their publication cadences instead of someone refreshing spreadsheets.
Transformations at the source: The FRED API's units parameter applies percent change (pch), year-over-year change (pc1), or natural log before data lands in Datagrid.
Frequency conversion built in: Daily or monthly series aggregate to lower frequencies using avg, sum, or end-of-period methods, so mixed-cadence indicators line up.
Point-in-time vintages for honest backtesting: ALFRED's vintage_dates and output_type parameters retrieve data as it existed on past dates, so models train on what was actually known at those dates.
Cross-source joins without scripts: Agents combine CPI and GDP with regional indicators, then join those signals to internal ERP, project, and CRM records across Datagrid's other integrations.
Threshold monitoring: Agents continuously monitor synced series and flag movements that exceed defined limits, so that FRED data drives alerts within Datagrid.
What you can build with FRED Datagrid integration
Use FRED with Datagrid when macroeconomic signals need to move into the same workflows as project, finance, warehouse, and account data. Datagrid's AI agents turn those signals into model inputs and recurring reporting or alert workflows.
Automated macroeconomic dashboard pipeline: Agents pull quarterly GDP and monthly unemployment data, join daily federal funds rate data into the same pipeline, normalize the mixed frequencies, and push current values to live dashboards.
Inflation-adjusted business reporting: Sync CPIAUCSL with the pc1 transformation and cross-reference it against internal revenue or procurement data. Agents distinguish price-driven shifts from performance-driven shifts in your numbers.
Economic context for project and bid decisions: Join MORTGAGE30US (30-year mortgage rate), HOUST (housing starts), and regional unemployment with internal project cost data. Project teams see the macro conditions behind cost trends without opening a browser tab.
Forecast model inputs with vintage backtesting: Pull historical series into Snowflake or BigQuery for feature engineering, then use ALFRED vintages to backtest against the data available on each historical decision date.
Resources and documentation
FRED API overview: Documents REST architecture, HTTPS transport, and supported response formats.
FRED API v2 index: Covers bulk release-level observation retrieval.
Series observations endpoint: Documents observation parameters, transformations, frequency conversion, and pagination.
FRED API key guide: Explains how FRED API credentials work.
FRED API terms: Licensing and permitted-use checks before routing synced data into Datagrid workflows.
Frequently asked questions
What authentication does the FRED integration require?
A FRED API key. You paste the key into Datagrid during setup. FRED supports API key authentication only.
Can I pull FRED data from a past date?
Yes, through ALFRED vintage parameters. The vintage_dates parameter on fred/series/observations accepts comma-separated dates, and output_type controls whether you get current values, all vintages, revisions only, or initial releases only. Vintage depth varies: major indicators go back decades, while many series only have versioned data from 2005 onward.
Are there restrictions on how I can use synced FRED data?
Yes. Third parties own some series, and FRED's legal notices state that you must contact the data owner for permission before using them for anything beyond personal use. You can identify copyrighted series by searching for "copyright" in the series notes field. Commercial publishers must secure written permission to republish FRED data.
Similar integrations
JDBC MySQL: Direct relational destination to ingest and join FRED time-series observations with operational MySQL datasets for analysis.
Google Cloud SQL - PostgreSQL: Sync FRED series into managed PostgreSQL on Cloud SQL to combine macroeconomic indicators with application data for reporting and modeling.
Azure PostgreSQL Database: Ingest FRED observations into Azure Database for PostgreSQL to power time-series analytics, forecasting, and joins with enterprise datasets.
Snowflake: Load FRED bulk releases into Snowflake for scalable time-series storage, cross-dataset joins, and model training using warehouse compute.
BigQuery: Stream or batch FRED observations into BigQuery to build dashboards, run analytics, and join economic indicators with internal metrics.
Amazon Redshift: Push FRED series into Amazon Redshift as a centralized analytics store for scheduled dashboards, backtesting, feature engineering, and operational joins.